> ## Documentation Index
> Fetch the complete documentation index at: https://inertiajs.com/docs/llms.txt
> Use this file to discover all available pages before exploring further.
# DevTools
Inertia DevTools is a Chrome extension that records every Inertia visit and displays it in a dedicated DevTools panel, showing exactly what each visit sent and received: which props were returned, whether they were deferred or merged, what the request headers were, and which route and controller handled it.
DevTools is a local development tool, designed to run alongside your local development server. The recorder is disabled outside your local environment by default, so DevTools stays out of production unless you explicitly allow it.
## Installation
There is no separate package to install in your app. DevTools ships inside the libraries you already use, so you only need the client-side adapter at `^3.6` and the Laravel adapter at `^3.2`.
Install Inertia DevTools from the [Chrome Web Store](https://chromewebstore.google.com/detail/inertiajs-devtools/cbaffpghpcbmgbnlpamegieokkpdlnih), or download the latest release from [GitHub](https://github.com/inertiajs/inertia-devtools/releases) and load it unpacked.
DevTools is enabled automatically in development, so most applications need no configuration to get started. To turn it on or off explicitly, or to access it from another environment, see [Enabling DevTools](#enabling-devtools).
Open Chrome DevTools on your Inertia app and select the "Inertia" panel. Navigate around your application and each visit will appear in the timeline.
Run the Vite development server for full functionality. In dev mode Inertia exposes the hooks the panel relies on for client-side detail such as visit options and request grouping. Without it, requests are still recorded, but some client-side features are unavailable.
## The Timeline
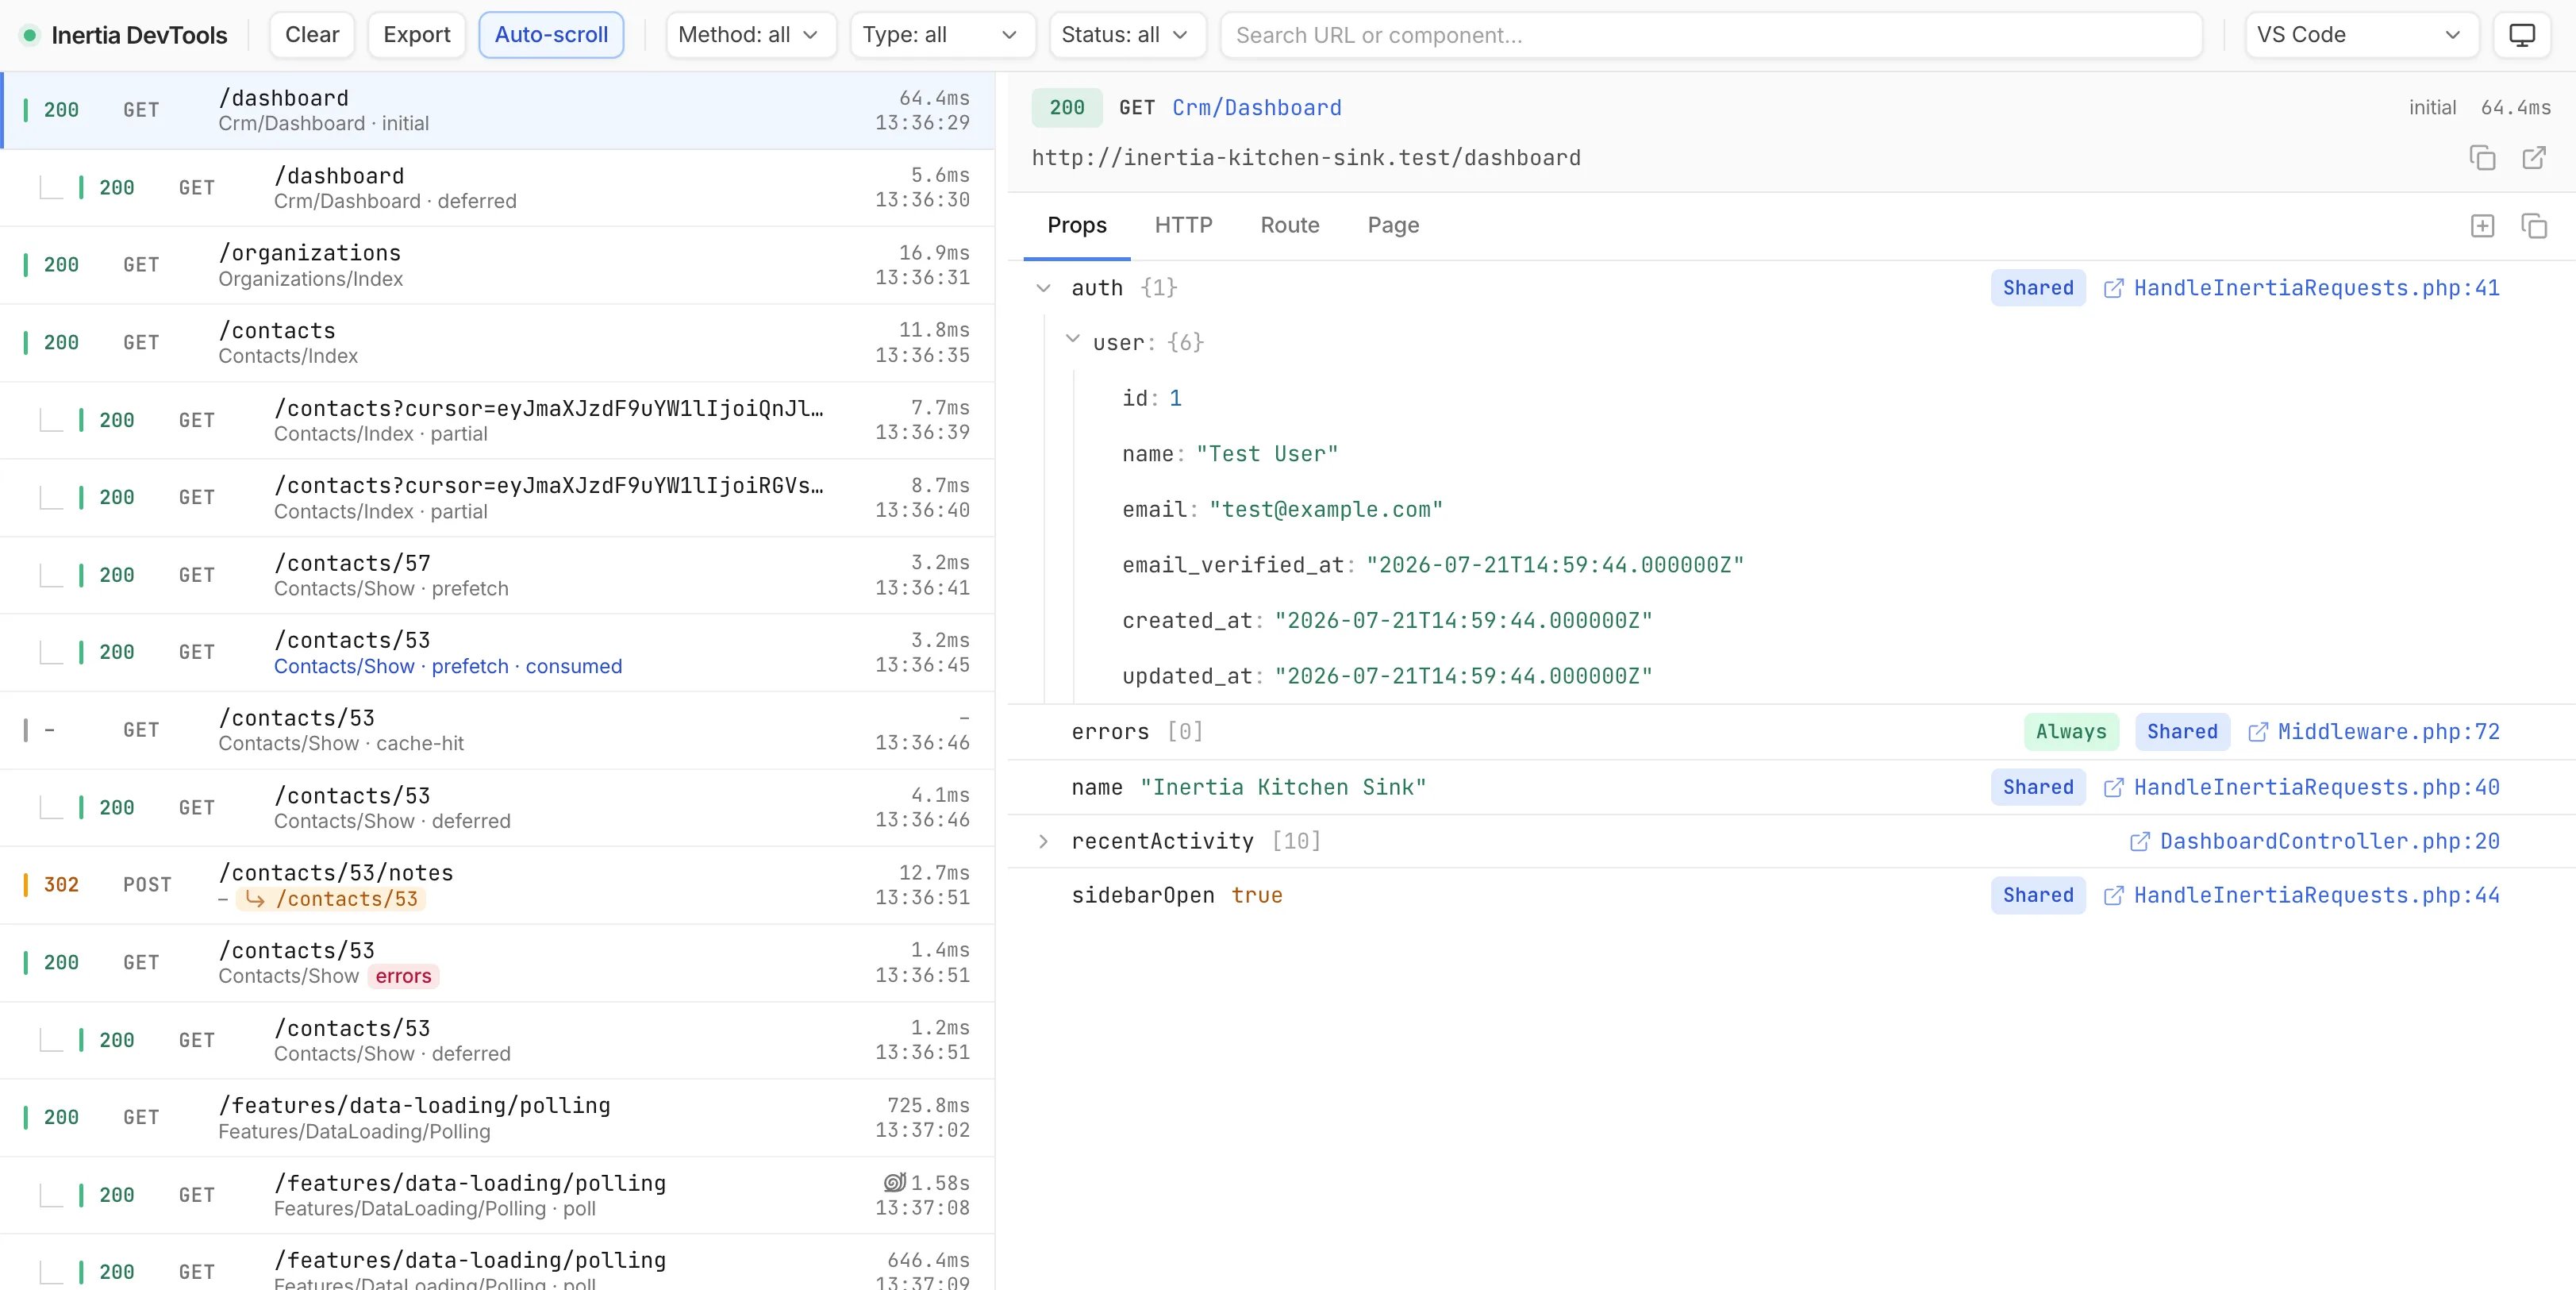
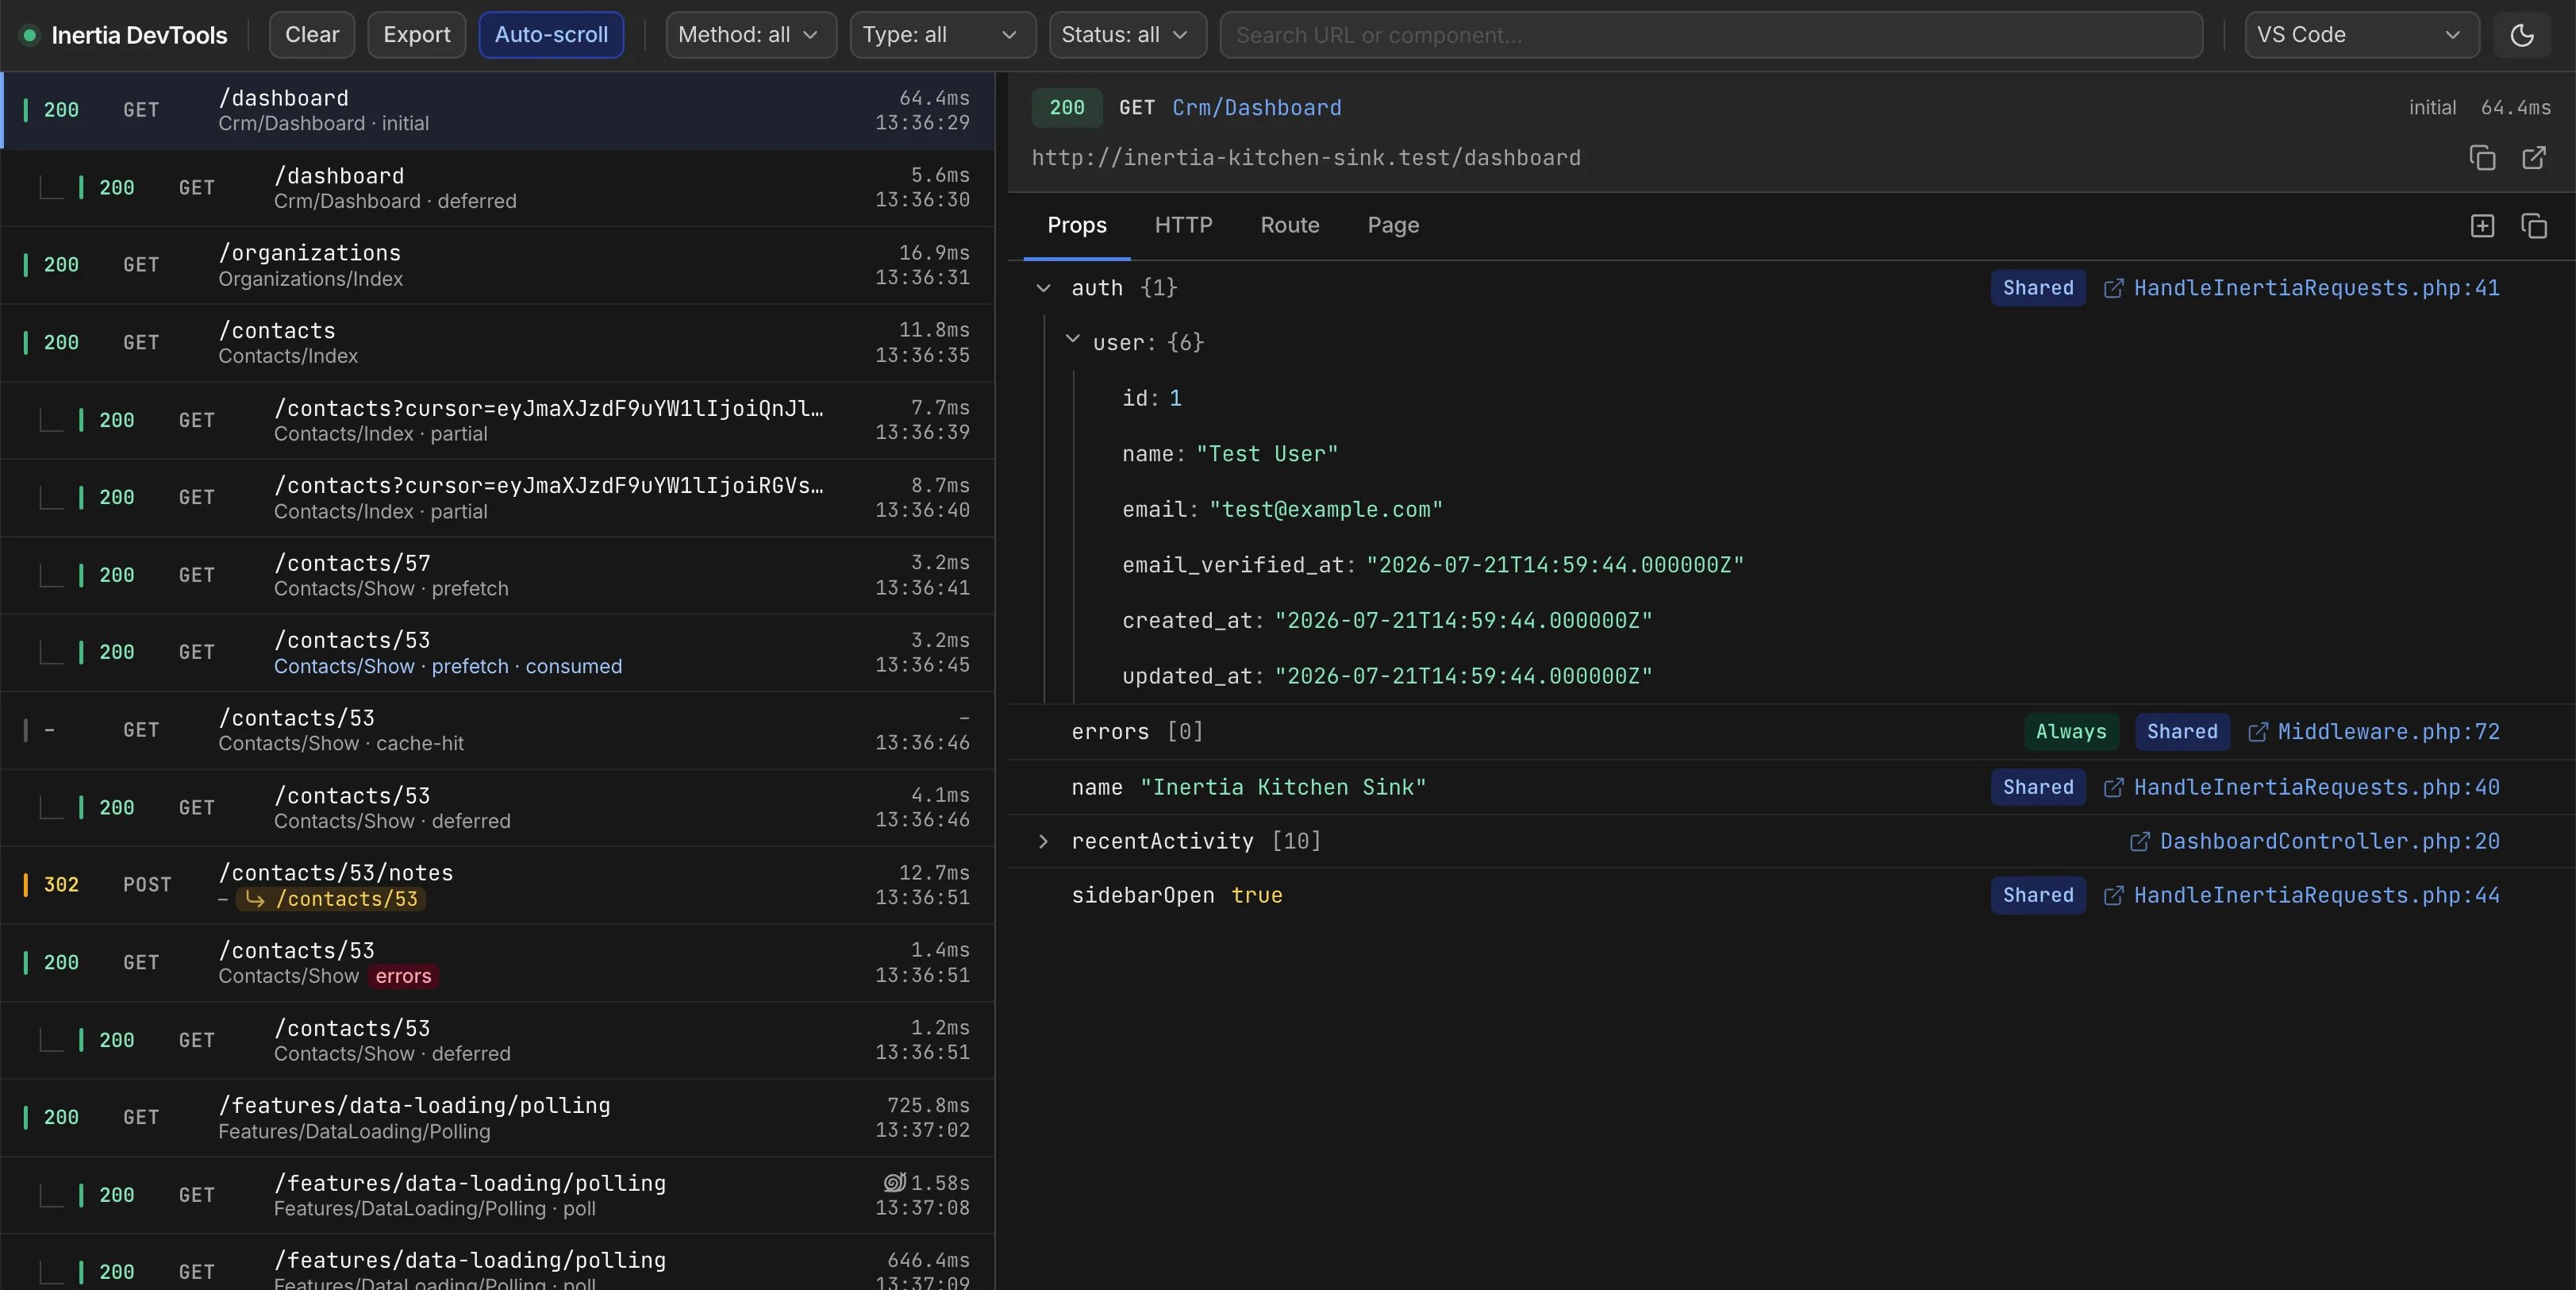
Every Inertia request is listed in the timeline on the left, with a live indicator while a request is in flight. You may filter by method, request type, or status, or search over the URL and component. Request types include full visits, [partial reloads](/docs/v3/data-props/partial-reloads), [deferred prop loads](/docs/v3/data-props/deferred-props), [polls](/docs/v3/data-props/polling), [prefetches](/docs/v3/data-props/prefetching), and [Precognition validation](/docs/v3/the-basics/forms#precognition). Related requests are grouped rather than listed separately, so a page visit and its follow-up requests appear together. The grouping is determined on the client, since only the browser tells a poll apart from a full navigation, or knows a prefetch was served from cache.
 ## Inspecting a Request
Selecting a request opens its detail, split into four tabs.
The **Props** tab lists every prop as a tree, each with a badge for its kind, whether deferred, optional, merged, or shared with `share()`, and a `file:line` link into your editor. Values expand inline. Alongside it, the **HTTP** tab shows the request and response headers and bodies with sensitive values redacted, and the **Route** tab shows the matched route name, URI, and controller action.
The **Page** tab shows the full page state after Inertia has handled the response. A partial reload might send only one prop over the wire, but Inertia merges it into the existing page, so this tab shows the complete result, not only what arrived in the response.
## Client-Side Events
Some interactions never reach the server, so the Network tab shows nothing for them. The extension records them as their own timeline entries: [Client Side Visits](/docs/v3/the-basics/manual-visits#client-side-visits) and requests served from the [prefetch](/docs/v3/data-props/prefetching) cache.
## Editor Links
File references throughout the panel link directly to your editor. You may use the editor picker in the toolbar to choose your editor. VS Code, PhpStorm, Cursor, and Zed register their URL schemes on install and work out of the box. Sublime Text ships no URL-scheme handler, so its links do nothing until you install one such as [SublimeUrl](https://github.com/inopinatus/sublime_url).
## How It Works
DevTools consists of two pieces that split the work across each request. The Laravel adapter records the server side as the response is prepared, while the Chrome extension captures the client side, and the two are paired into a single timeline entry. They communicate over a [documented protocol](/docs/v3/advanced/devtools-protocol) that any server adapter may implement, with the Laravel adapter serving as the reference implementation. Entries are stored locally over the same origin, so nothing is sent to a remote service and no account or cloud sync is required.
## Enabling DevTools
DevTools has two independent switches, one server-side and one client-side, both defaulting to on in development and off in production.
The server recorder is controlled by the `INERTIA_DEVTOOLS_ENABLED` environment variable, enabled automatically in your local environment. You may set it explicitly to override that default.
```env theme={null}
INERTIA_DEVTOOLS_ENABLED=false
```
The client hooks are controlled by the `dev` option in `createInertiaApp()`, which defaults to Vite's development mode. These hooks expose the visit options and request grouping described above, so turning them off leaves the timeline recording requests without that client-side detail.
```js theme={null}
createInertiaApp({
// ...
dev: import.meta.env.DEV,
})
```
To disable the panel itself, toggle the extension off from `chrome://extensions`.
## Configuration
The recorder is configured under the `devtools` key in your `config/inertia.php` file, with environment variables for the most common options.
### Redaction
Sensitive prop keys and headers are redacted before an entry is stored, so values such as passwords, tokens, and authorization headers never reach the panel. You may customize the redacted keys and headers under `devtools.redact` in your configuration file.
Certain paths are excluded from recording entirely, including the DevTools endpoints themselves and common tooling routes such as Telescope and Horizon. You may adjust the `devtools.except` array to record or ignore additional paths.
### Storage
Entries are written to `storage/inertia-devtools` and pruned automatically. You may adjust the retention, limit, and storage path under `devtools.storage` in your configuration file.
### Enabling Outside Local
The recorder is restricted to your local environment by default. To allow access beyond it, define a gate and reference it with the `INERTIA_DEVTOOLS_GATE` environment variable.
```php theme={null}
// app/Providers/AppServiceProvider.php
use Illuminate\Support\Facades\Gate;
Gate::define('viewInertiaDevTools', function ($user) {
return $user->isAdmin();
});
```
```env theme={null}
INERTIA_DEVTOOLS_ENABLED=true
INERTIA_DEVTOOLS_GATE=viewInertiaDevTools
```
Outside your local environment the DevTools endpoints authorize each request against the gate, refusing it when no gate is configured. Your local environment is always allowed, so a gate can never lock you out of DevTools while you work locally.
The endpoints run the `web` middleware group before they authorize, so the session has resolved the authenticated user by the time the gate runs. You may adjust that stack under `devtools.middleware` in your configuration file if your application authenticates its users another way.
## Inspecting a Request
Selecting a request opens its detail, split into four tabs.
The **Props** tab lists every prop as a tree, each with a badge for its kind, whether deferred, optional, merged, or shared with `share()`, and a `file:line` link into your editor. Values expand inline. Alongside it, the **HTTP** tab shows the request and response headers and bodies with sensitive values redacted, and the **Route** tab shows the matched route name, URI, and controller action.
The **Page** tab shows the full page state after Inertia has handled the response. A partial reload might send only one prop over the wire, but Inertia merges it into the existing page, so this tab shows the complete result, not only what arrived in the response.
## Client-Side Events
Some interactions never reach the server, so the Network tab shows nothing for them. The extension records them as their own timeline entries: [Client Side Visits](/docs/v3/the-basics/manual-visits#client-side-visits) and requests served from the [prefetch](/docs/v3/data-props/prefetching) cache.
## Editor Links
File references throughout the panel link directly to your editor. You may use the editor picker in the toolbar to choose your editor. VS Code, PhpStorm, Cursor, and Zed register their URL schemes on install and work out of the box. Sublime Text ships no URL-scheme handler, so its links do nothing until you install one such as [SublimeUrl](https://github.com/inopinatus/sublime_url).
## How It Works
DevTools consists of two pieces that split the work across each request. The Laravel adapter records the server side as the response is prepared, while the Chrome extension captures the client side, and the two are paired into a single timeline entry. They communicate over a [documented protocol](/docs/v3/advanced/devtools-protocol) that any server adapter may implement, with the Laravel adapter serving as the reference implementation. Entries are stored locally over the same origin, so nothing is sent to a remote service and no account or cloud sync is required.
## Enabling DevTools
DevTools has two independent switches, one server-side and one client-side, both defaulting to on in development and off in production.
The server recorder is controlled by the `INERTIA_DEVTOOLS_ENABLED` environment variable, enabled automatically in your local environment. You may set it explicitly to override that default.
```env theme={null}
INERTIA_DEVTOOLS_ENABLED=false
```
The client hooks are controlled by the `dev` option in `createInertiaApp()`, which defaults to Vite's development mode. These hooks expose the visit options and request grouping described above, so turning them off leaves the timeline recording requests without that client-side detail.
```js theme={null}
createInertiaApp({
// ...
dev: import.meta.env.DEV,
})
```
To disable the panel itself, toggle the extension off from `chrome://extensions`.
## Configuration
The recorder is configured under the `devtools` key in your `config/inertia.php` file, with environment variables for the most common options.
### Redaction
Sensitive prop keys and headers are redacted before an entry is stored, so values such as passwords, tokens, and authorization headers never reach the panel. You may customize the redacted keys and headers under `devtools.redact` in your configuration file.
Certain paths are excluded from recording entirely, including the DevTools endpoints themselves and common tooling routes such as Telescope and Horizon. You may adjust the `devtools.except` array to record or ignore additional paths.
### Storage
Entries are written to `storage/inertia-devtools` and pruned automatically. You may adjust the retention, limit, and storage path under `devtools.storage` in your configuration file.
### Enabling Outside Local
The recorder is restricted to your local environment by default. To allow access beyond it, define a gate and reference it with the `INERTIA_DEVTOOLS_GATE` environment variable.
```php theme={null}
// app/Providers/AppServiceProvider.php
use Illuminate\Support\Facades\Gate;
Gate::define('viewInertiaDevTools', function ($user) {
return $user->isAdmin();
});
```
```env theme={null}
INERTIA_DEVTOOLS_ENABLED=true
INERTIA_DEVTOOLS_GATE=viewInertiaDevTools
```
Outside your local environment the DevTools endpoints authorize each request against the gate, refusing it when no gate is configured. Your local environment is always allowed, so a gate can never lock you out of DevTools while you work locally.
The endpoints run the `web` middleware group before they authorize, so the session has resolved the authenticated user by the time the gate runs. You may adjust that stack under `devtools.middleware` in your configuration file if your application authenticates its users another way.